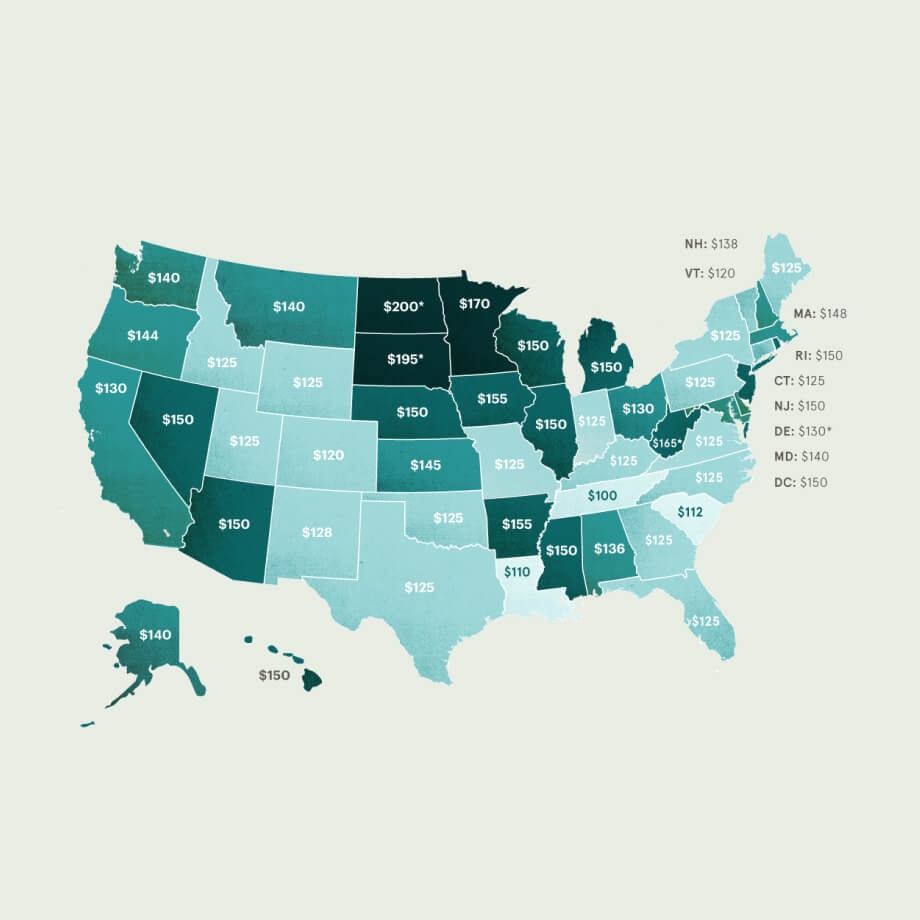
2018 Therapy Session Rates Nationwide
Learn how to set your rates in private practice
Download free resource
Enter your email below to access this resource.
By entering your email address, you are opting-in to receive emails from SimplePractice on its various products, solutions, and/or offerings. Unsubscribe anytime.

As you build your practice and client list, you may struggle with one important question—how much should you charge? While we can’t answer that question for you, we can provide insight into what others in your area charge for specific services.
Along with specialty, degree, and years of experience, what others are charging helps determine what rate is right for your business. So, if you have ever had any uncertainty about what to charge or how much to increase your session rates, keep reading.
Looking for an updated version? In 2024, we conducted a comprehensive analysis of nearly 105 million sessions (both self-pay and insurance) conducted in 2023-2024 using SimplePractice data* on CPT codes for psychotherapy.
This unprecedented dataset from nearly 204,000 behavioral health therapists located in all 50 states and the District of Columbia, reveals the true cost of therapy in America today.
*NOTE: All data used in this analysis is completely anonymous. SimplePractice does not sell therapist data at any time for any reason.
The data included in this white paper reflect actual session rate data billed by SimplePractice customers in the U.S. from 2019 to 2024 for both self pay and insurance pay sessions.
This report also includes data from 104,679,056 session fees (self pay and insurance pay) collected in 2023-2024, from nearly 204,000 behavioral therapists located in all 50 states and the District of Columbia, who use the SimplePractice EHR platform and reported treatments using CPT codes 90832, 90833, 90834, 90836, 90837, and 90838.